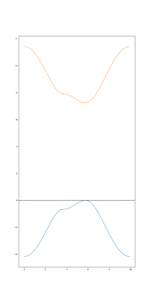
Here a simple example to calculate the band structure of monolayer hBN along the Gamma->K->M->Gamma path.
using HopTB
using PyPlot
lat = [1 1/2 0; 0 √3/2 0; 0 0 1]
site_positions = lat*([1/3 1/3 0; 2/3 2/3 0]’);
# TBmodel the second vector is orbital type (s in this case one for site)
tm = TBModel(lat,site_positions,[[0], [0]])
# Parameters from Phys. Rev. B 94, 125303
t_0 =2.30 # eV
E_gap=3.625*2.0 # eV
addhopping!(tm, [0, 0, 0], (1, 1), (1, 1), -E_gap/2.0)
addhopping!(tm, [0, 0, 0], (2, 1), (2, 1), E_gap/2.0)
addhopping!(tm, [0, 0, 0], (1, 1), (2, 1), t_0)
addhopping!(tm, [-1, 0, 0], (1, 1), (2, 1), t_0)
addhopping!(tm, [0, -1, 0], (1, 1), (2, 1), t_0)
kpath=zeros(Float64,3,4)
kpath[:,1]=[0.0, 0.0, 0.0] # Γ
kpath[:,2]=[0.0, 0.5, 0.0] # M
kpath[:,3]=[1.0/3.0, 2.0/3.0, 0.0] # K
kpath[:,4]=[0.0 , 0.0, 0.0] # Γ
kdist, egvals = HopTB.BandStructure.getbs(tm, kpath, 50, connect_end_points=true)
fig = figure(“Band structure monolayer hBN”,figsize=(10,20))
max_val=findmax(egvals[1,:])[1]
egvals=egvals.-max_val
plot(kdist,egvals[1,:])
plot(kdist,egvals[2,:])
PyPlot.axhline(0.0,color=”black”,linestyle=”–“)
PyPlot.show()
