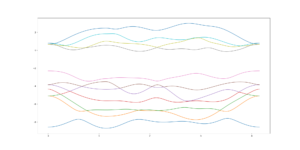
Here a simple example of construction of TB-Hamiltonian from Wannier90 output
using HopTB

using PyPlot
wfile="WS2.w90"
tb_from_w90=HopTB.Interface.createmodelwannier(wfile)
kpath=zeros(Float64,3,4)
kpath[:,1]=[0.0, 0.0, 0.0] # Γ
kpath[:,2]=[0.0, 0.5, 0.0] # M
kpath[:,3]=[1.0/3.0, 2.0/3.0, 0.0] # K
kpath[:,4]=[0.0 , 0.0, 0.0] # Γ
kdist, egvals = HopTB.BandStructure.getbs(tb_from_w90, kpath, 50, connect_end_points=true)
fig = figure("Band structure of WS2",figsize=(20,10))
println(size(egvals,1))
for ib in 1:size(egvals,1)
plot(kdist,egvals[ib,:])
end
PyPlot.savefig("W90_bands.png")
PyPlot.show()
